Use these 2 Metrics to measure Employee Experience Success
Intuitively, we know what a “good” employee experience ought to be, but how do we measure it? In this blog, we’ll explore the two metrics that define EX Success

Written by
Joris Luijke, Co-Founder & Co-CEO
From interviews with Heads of Employee Experience, we know that a key challenge is to clearly articulate Employee Experience ‘success’.
Intuitively, we know what a “good” employee experience ought to be, but how do we measure it?
Successful EX Leaders tend to measure progress by using simple, clear metrics when communicating to executive leadership and the company.
Because the role is new, people don't necessarily understand the value of it, and executives can have a hard time connecting the dots.
Shilpam Moffett, Former Director of EX at Yelp
The metrics to use when you want to measure EX success are:
- Coverage
- Sentiment
In this blog, we’ll explore both. Together they create a metric that can be managed like other business metrics such as Customer Acquisition Cost (CAC), Annual Recurring Revenue (ARR), and Customer Retention (Churn).
Your EX Strategy Framework
The journey to great EX starts with an Employee Journey Map - try out Pyn's Employee Journey Designer to build your map. Similar to a Customer Journey (the framework used by go-to-market teams) the Employee Journey provides a framework to prioritize and measure the work that needs to be done to ensure that your employee experience is top-notch.
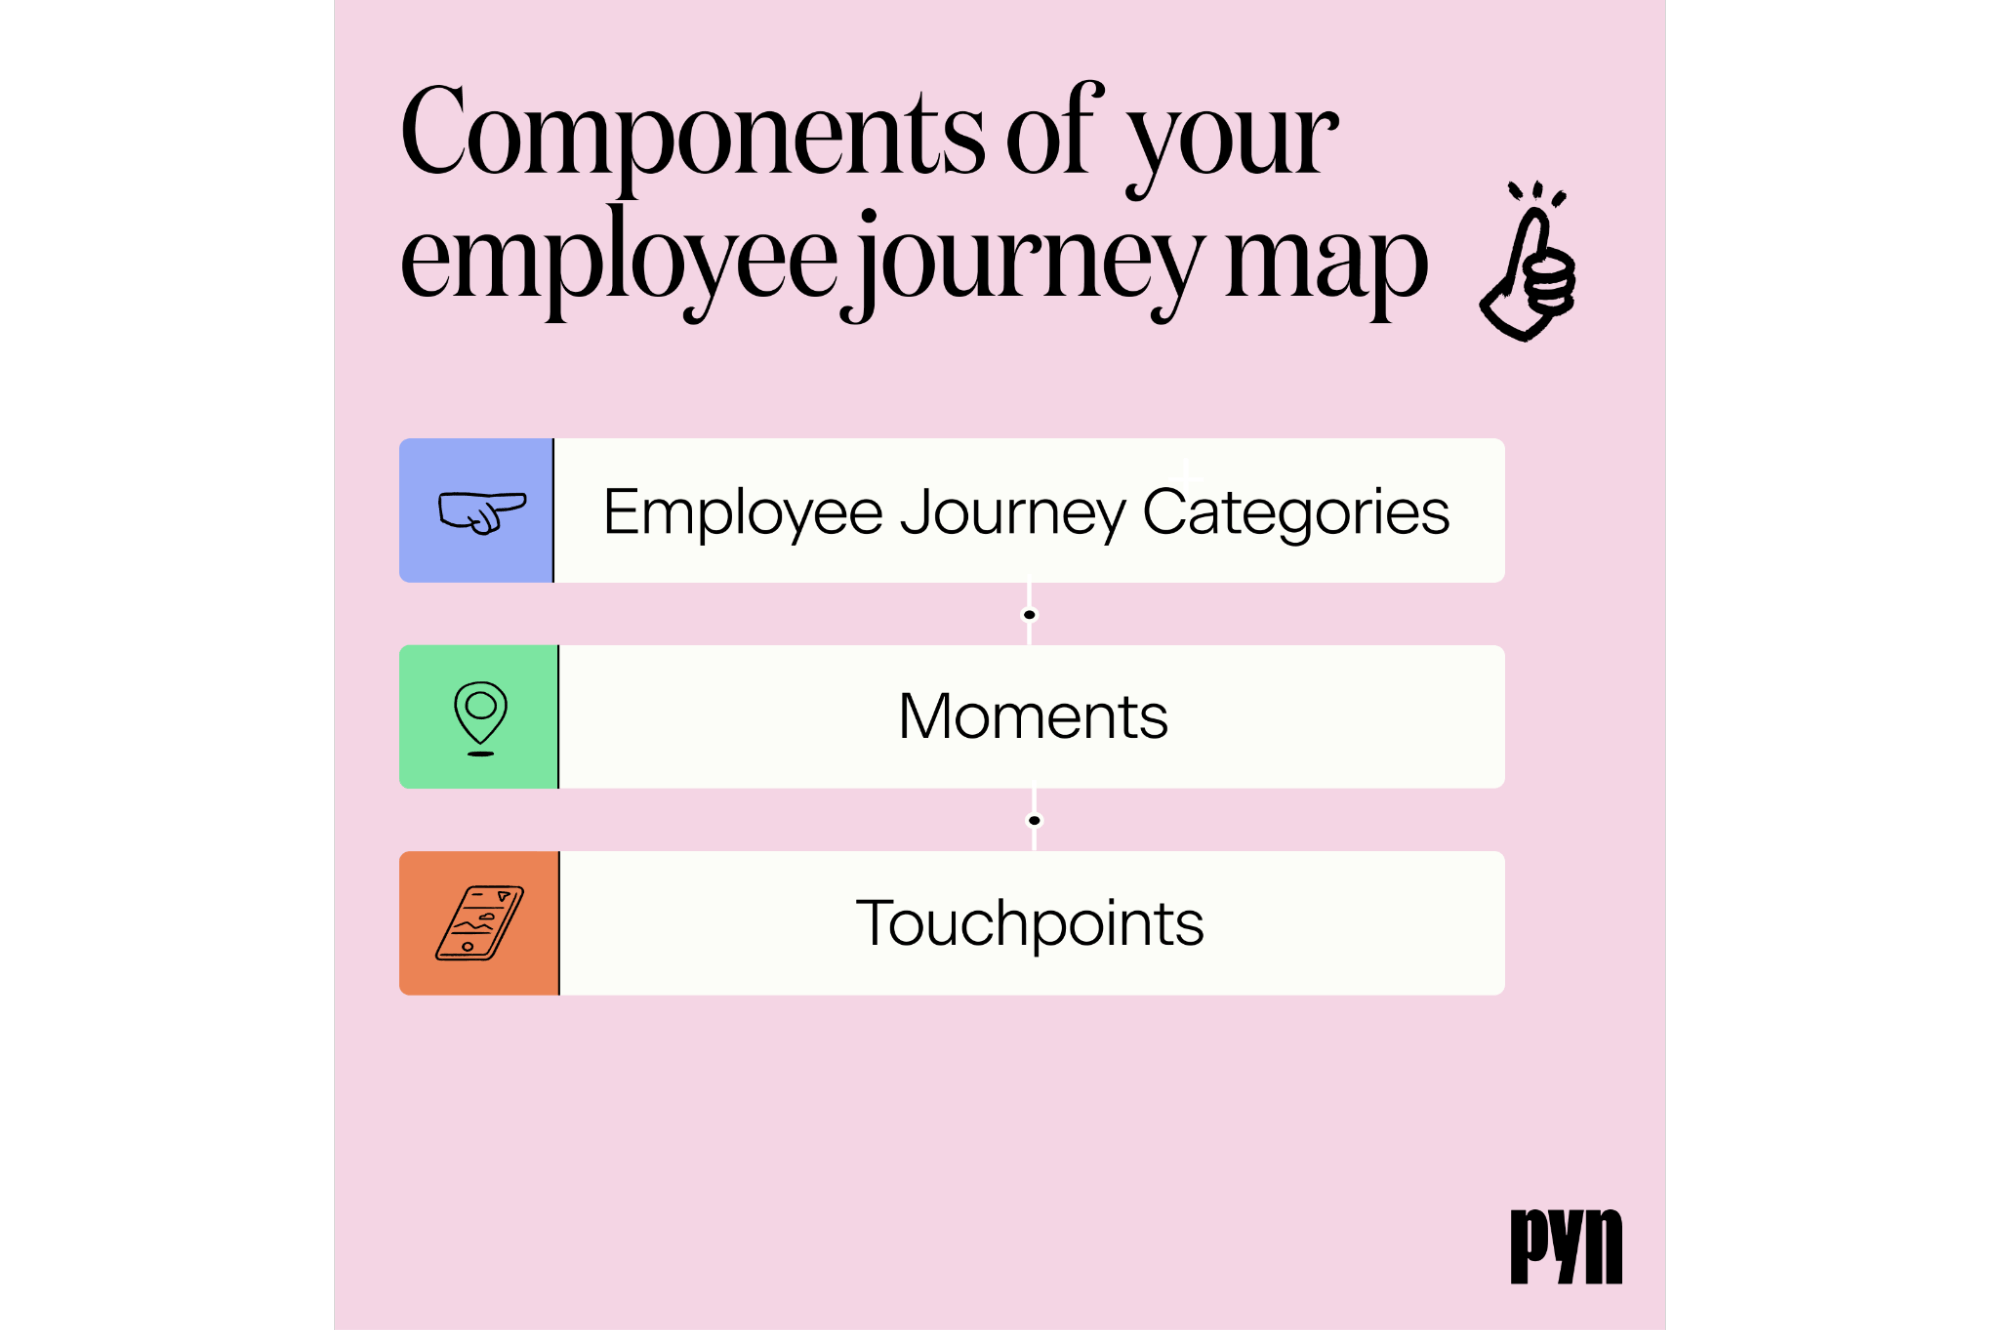
An Employee Journey Map consists of the following components:

There are multiple Categories:
Examples Categories: ‘Onboarding’ or ‘Life Events’
Each Category has Moments that Matter:
Example Moment that Matters: ‘The First Day’ (within ‘Onboarding’ Category)
Each Moment that Matters has Touchpoints:
Examples Touchpoints: ‘New Hire First Week Plan’ or ‘Hiring Manager Instructions’ (within ‘First Day’ Moment that Matters)
For more on Employee Journey Mapping, check out my blog post on the topic, and access our free Employee Journey Designer that helps you create your company's own journey.
Coverage
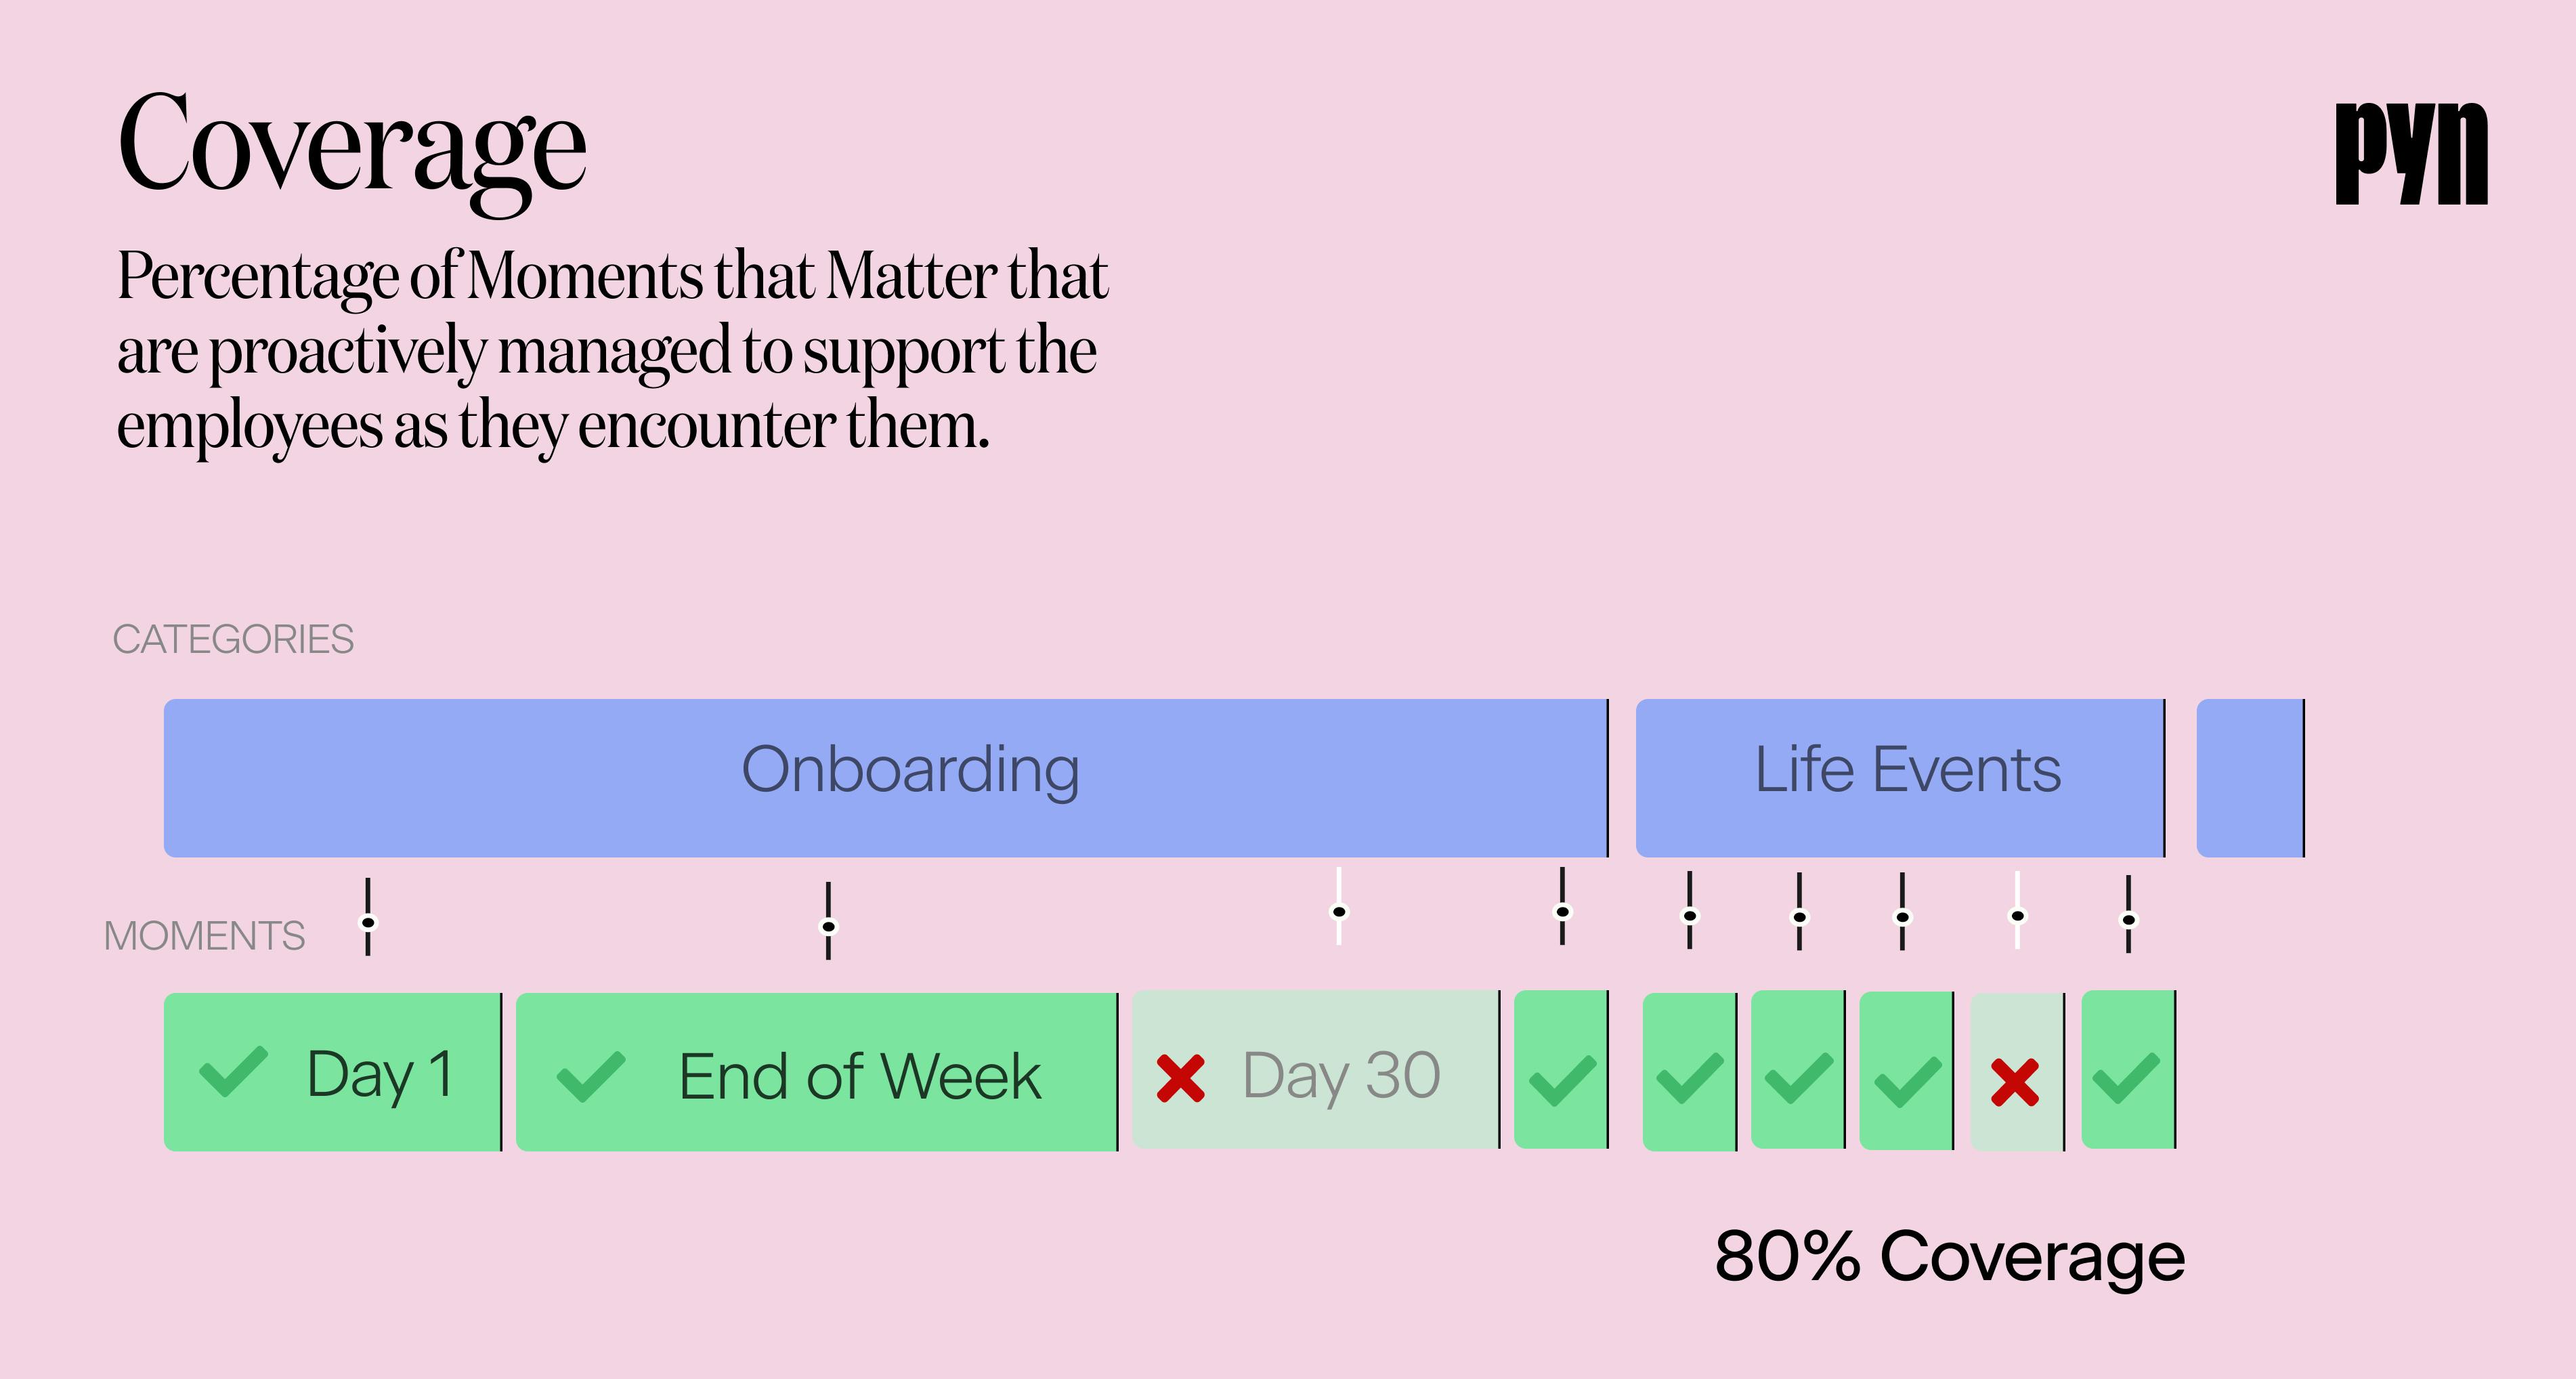
Percentage of Moments that Matter that are proactively managed to support the employees as they encounter them.
It’s important that when an employee encounters a Moment that Matters, they get timely guidance, instructions or support to confidently manage that situation. Companies who level up their EX set out to turn each such Moment into a good experience.

For example, a person who is just promoted to manager will need to know their new responsibilities and will be organizing a first 1:1 with their new reports. Great EX in that situation would require that new manager to be provided with timely resources and support to feel confident at that key moment.
Collectively our goal is to tune into the voice of the employee, invest in the experiences that have the greatest impact so that we unlock individual, team, and business performance
Tracy Krilich, Head of EX at Uber
Sentiment
Employee mood or sentiment score about the different parts of the journey.
Different parts of the journey include, for example, onboarding journey, new manager journey, and the exit journey. Sentiment is measured through surveying your employees.
If, instead, you want one quicker overall score, you can also use your Employee Engagement Score. Employee engagement can be measured by surveying the general mood of your entire employee experience in the organization by measuring the percentage of employees who answer engagement related questions with ‘agree’ or ‘strongly agree.’
For example, you can survey every new manager about their experience becoming a new manager. And you can do an annual engagement survey for insights into the overall EX.
Why are these 2 metrics together so powerful?
Employee Journey Coverage is a leading indicator. Focus on Coverage helps you direct your EX efforts in the most meaningful way.
Employee Sentiment or Engagement is a lagging indicator. It can be used as input for further discussion to improve Employee Journey Coverage.
Using a combination of leading and lagging indicators is powerful because it provides you with a comprehensive, balanced perspective for decision-making. Leading indicators offer foresight, helping you anticipate trends and act proactively, while lagging indicators provide historical context and validate the effectiveness of past actions.
This combination enables better risk management, performance improvement, and adaptability in decision-making, creating a feedback loop that promotes continuous improvement.
Keep track and celebrate progress
Your lagging Sentiment indicator which can be used to celebrate progress over a long period period of time. The problem is that it's harder to use this metric to celebrate progress week to week.
Thankfully, your leading Coverage indicator is perfect to celebrate ongoing progress. In weekly team meetings you can review if the percentage coverage has increased. As soon as your team has made improvements to a Moments that Matters the percentage coverage will go up!
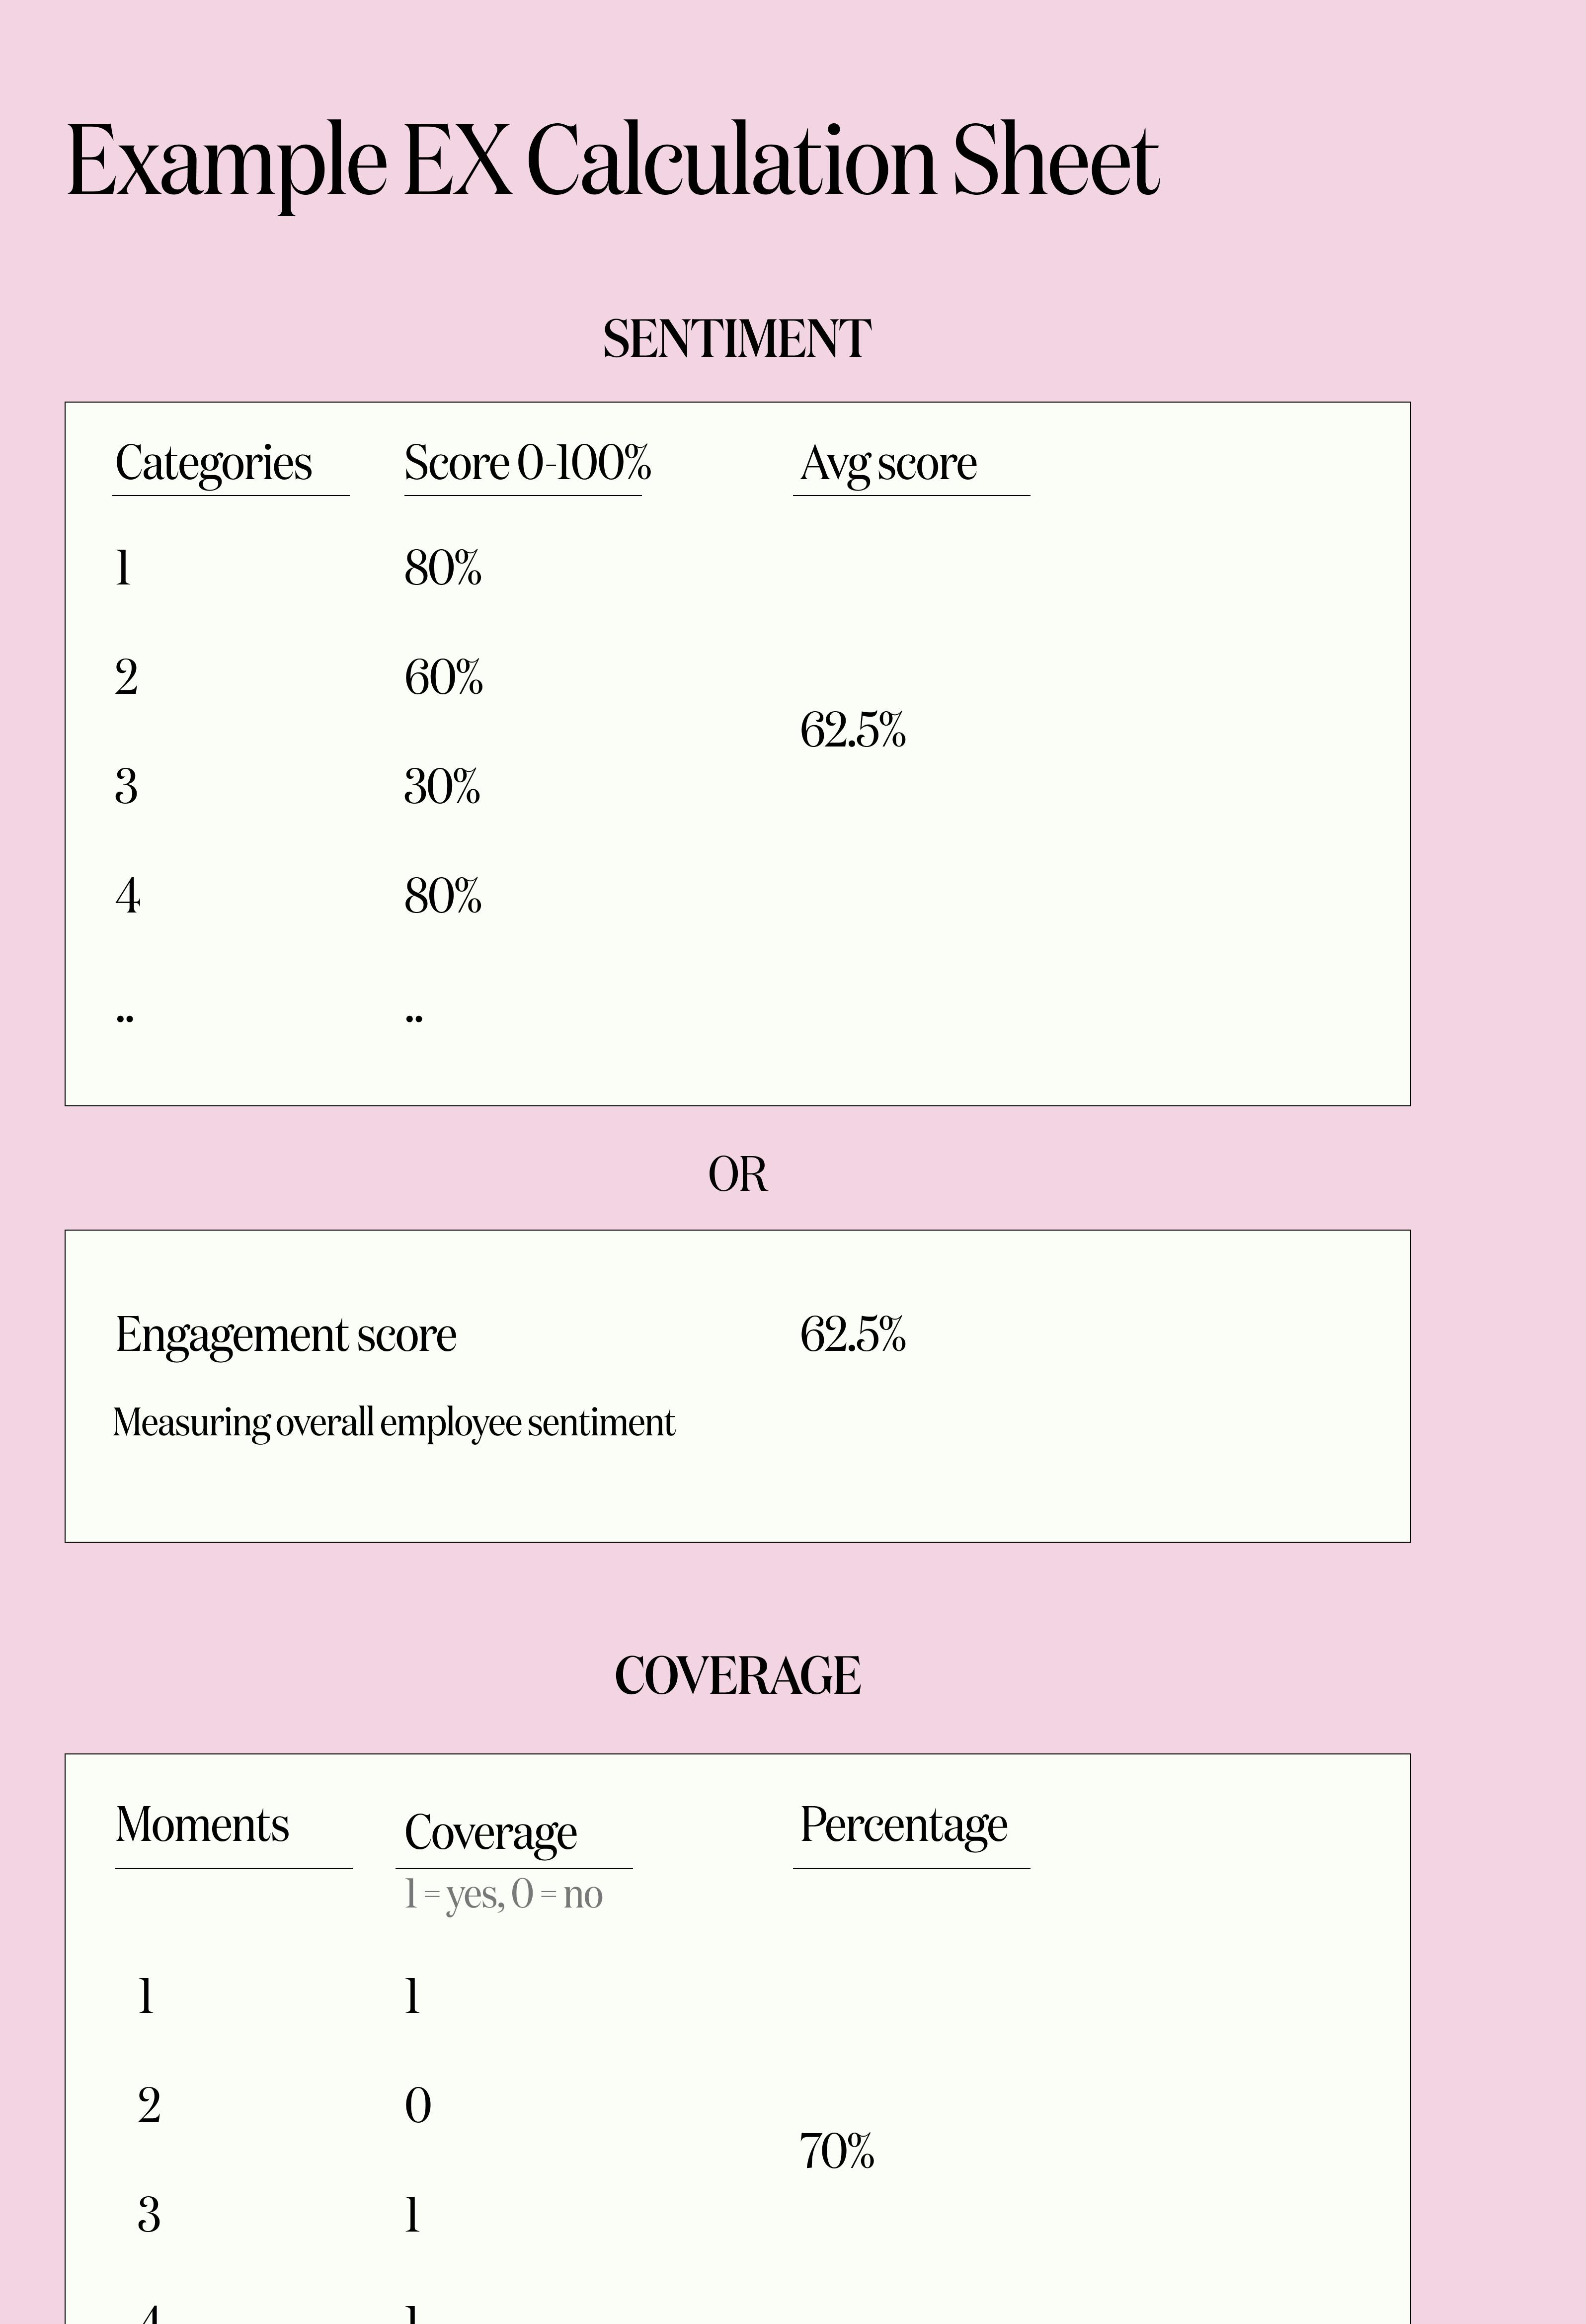
To keep track you can use a simple spreadsheet (see example below)


Joris dreamt of having Pyn as Head of People at Atlassian and Squarespace. Now dreams of getting a sleep-in on Sunday.
